A free Premium account on the FCL.055 website! Read here
Sign up to unlock all our services and 15164 corrected and explained questions.
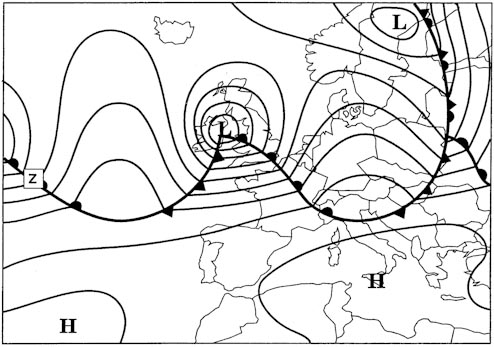
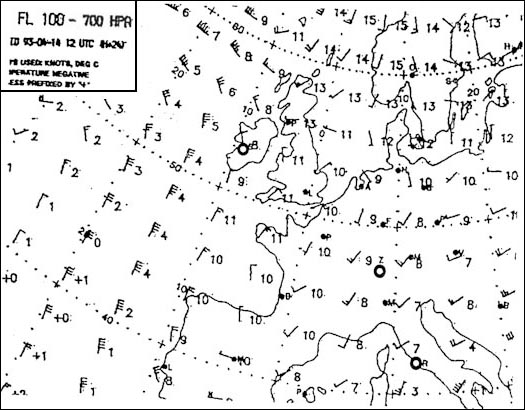
Question 167-1 : Refer to the diagram assuming the usual direction of movement where will this polar frontal wave have moved 260 ? [ Formation assignment ]
Position 3
Question 167-2 : What is the classification of the airmass affecting position 'q' at 0600 utc 261 ?
Question 167-3 : In which of the following regions does maritime polar air originate ?
East of greenland.
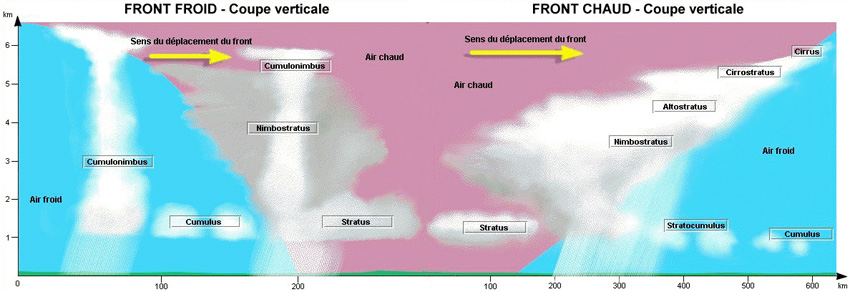
A polar maritime air mass originates over the northern part of the north atlantic ocean east of greenland it is unstable cool and moist air and can produce anything from cumulus to cumulonimbus with showers and sunny spells in between 611Region of british isles. baltic sea. black sea.
Question 167-4 : In which of the following situations can freezing rain be encountered ?
Ahead of a warm front in the winter.
505freezing rain is encountered ahead of a warm front in winter and in summer and sometimes behind a cold front Ahead of a cold front in the winter. behind a warm front in the summer. ahead of a cold front in the summer.
Question 167-5 : How do air masses move at a warm front ?
Warm air overrides a cold air mass.
505in a warm front warm air overrides a cold air massCold air overrides a warm air mass. cold air undercuts a warm air mass. warm air undercuts a cold air mass.
Question 167-6 : What type of precipitation would you expect at an active unstable cold front ?
Showers associated with thunderstorms.
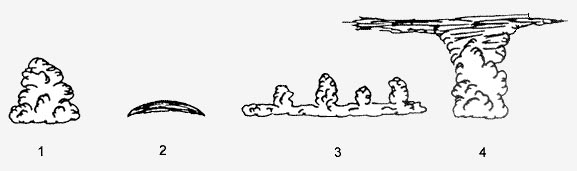
614an air mass is unstable when an ascending parcel of air continues to rise to a considerable height eg cb an unstable air mass will normally be characterised by cumuliform cloud and good visibility except in precipitation Freezing rain. light to moderate continuous rain. drizzle.
Question 167-7 : What is the relative movement of the two air masses along a cold front ?
Cold air pushes under a warm air mass.
621along a cold front the cold air pushes the warm air upWarm air pushes over a cold air mass. cold air slides over a warm air mass. warm air pushes under a cold air mass.
Question 167-8 : What cloud cover is typical for a wide warm sector of a polar front depression over central europe in the summer ?
Fair weather cu.
In a wide warm sector in summer over land you will have fair weather cumulus in winter you will have stratus mist and drizzle 516Bkn cu and cb. sky clear. st with drizzle.
Question 167-9 : Which of the following describes a warm occlusion ?
The coldest air mass is ahead of the original warm front.
With a warm occlusion cold front rides up and over the warm front 639 626in a warm occlusion the wedge of warm air from a warm sector depression is pushed up by the fast moving cold front and carried along aloft as the depression movesThe air mass behind the front is more unstable than the air mass ahead of the front. the air mass ahead of the front is drier than the air mass behind the front. the warmer air mass is ahead of the original warm front.
Question 167-10 : When do cold occlusions occur most frequently in europe ?
Summer.
Over europe we get more warm occlusions in the winter and more cold occlusions in the summerWinter. autumn and winter. winter and spring.
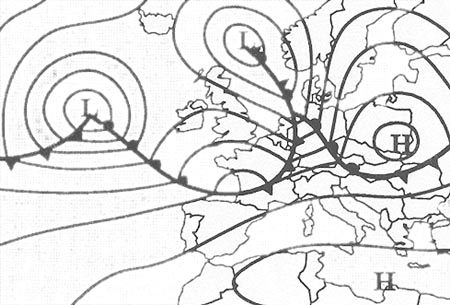
Question 167-11 : In which main direction does a polar front depression move ?
Along the front towards the east.
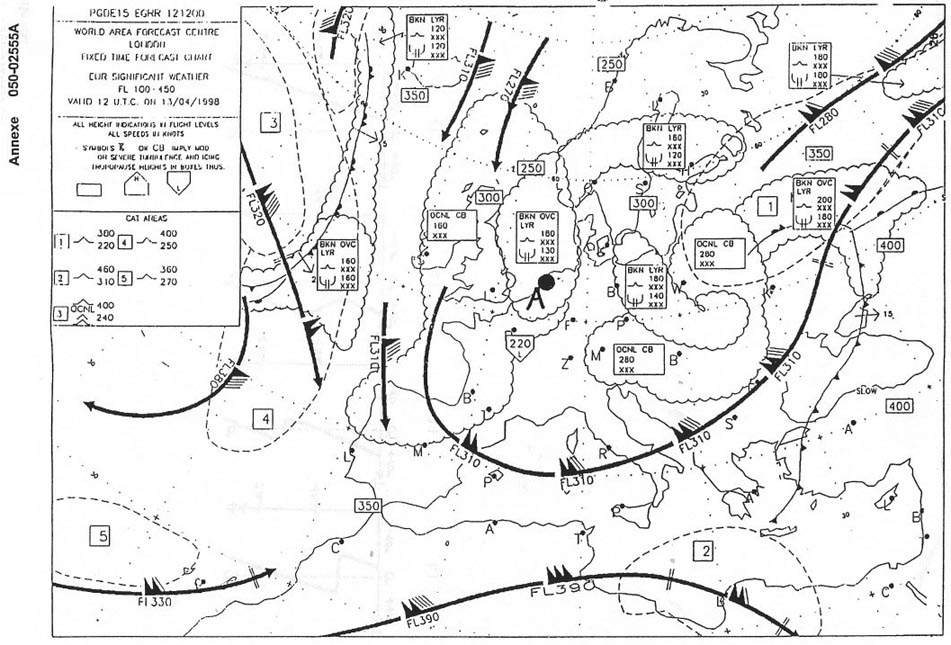
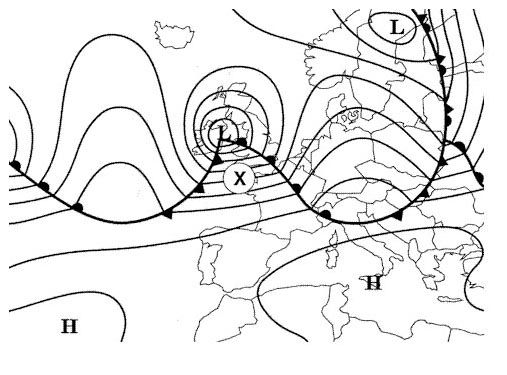
Depressions affecting western europe develop over the atlantic where cold polar air meets warm tropical air then moves east steered by the strong winds aloft this boundary is known as the polar front as show in this picture 517Along the front towards the west. across the front towards the north. across the front towards the south.
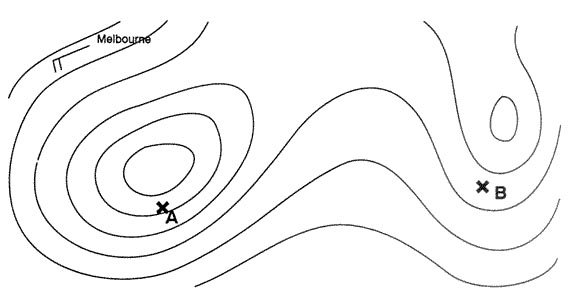
Question 167-12 : What change in pressure will occur at point a during the next hour 263 ?
A rise in pressure.
518as the cold front moves away the barometer starts risingA drop in pressure. irregular fluctuations. approximately constant pressure.
Question 167-13 : What is the most likely cause of a lack of clouds at higher levels in a stationary high ?
Sinking air.
500with convergence aloft and divergence at the surface sinking air will dissipate cloudRising air. instability. divergence at higher levels.
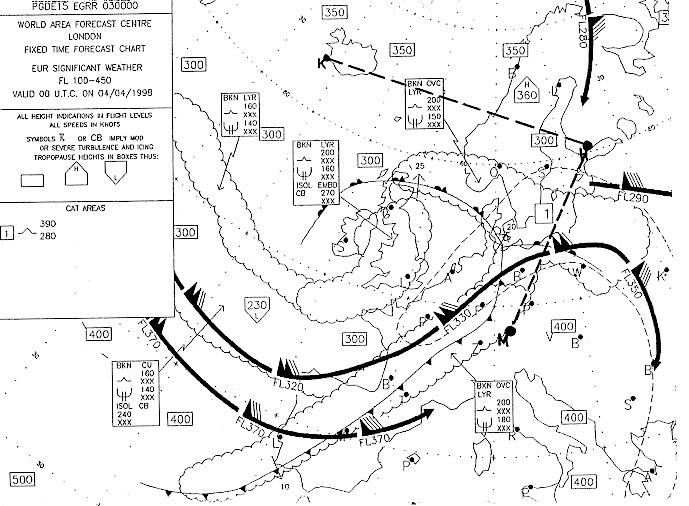
Question 167-14 : The front labelled 'z' is a 279 ?
Warm front.
Cold front. cold occlusion. warm occlusion.
Question 167-15 : What is the speed of the front located over france 284 ?
15 kt.
64525 kt 10 kt 30 kt
Question 167-16 : How are the air masses distributed in a cold occlusion ?
The coldest air mass behind and the less cold air in front of the occlusion the warm air mass is above ground level.
537cold front 'lifts' the warm front up and over the very cold airThe coldest air in front of and the less cold air is behind the occlusion, the warm air mass is above ground level. the coldest air in front of and the warm air behind the occlusion, the less cold air is above ground level. the coldest air behind and the warm air in front of the occlusion, the less cold air mass is above ground level.
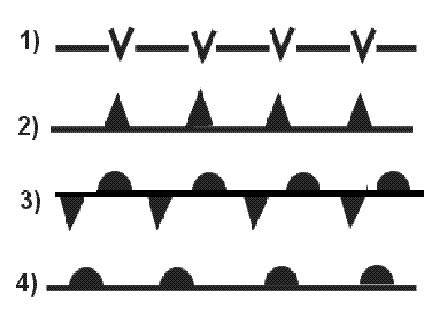
Question 167-17 : What characterizes a stationary front ?
The surface wind usually has its direction parallel to the front.
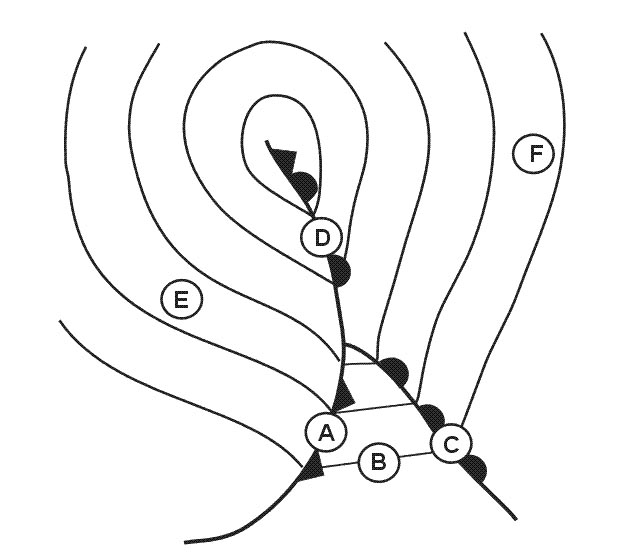
A stationary front forms when a cold front or warm front stops moving this happens when two masses of air are pushing against each other but neither is powerful enough to move the other winds blowing parallel to the front instead of perpendicular can help it stay in place 538a stationary front may stay put for days if the wind direction changes the front will start moving again becoming either a cold or warm front or the front may break apartthe weather is often cloudy along a stationary front and rain or snow often falls especially if the front is in an area of low atmospheric pressureon a weather map a stationary front is shown as alternating red semicircles and blue triangles the blue triangles point in one direction and the red semicircles point in the opposite directionThe surface wind usually has its direction perpendicular to the front. the warm air moves at approximately half the speed of the cold air. the weather conditions that it originates is a combination between those of an intense cold front and those of a warm and very active front.
Question 167-18 : In an intense trough of low pressure over iceland during wintertime the weather likely to be experienced is ?
Strong wind shear convection and snow showers.
With a trough of low pressure over iceland and due to the coriolis effect a consequence of the earth's rotation this in turn gives rise to a strong flow of cold air from greenland which imply below normal temperatures in western greenland and over iceland the weather likely to be experienced is strong wind shear convection and snow showers in winterStrong wind associated with an almost clear sky. strong wind with subsidence at low levels. light wind, good visibility and a high cloud ceiling.
Question 167-19 : Where are you likely to find the strongest winds close to the ground ?
In the transition zone between two air masses.
At the centre of a low pressure system a low or at the centre of a high pressure system a high and over area where there is little pressure gradient little variation in pressure over a large area winds are very lighton the other hand in the transition zone between two air masses at a warm front or a cold front you will find the strong winds close to the groundAt the centre of a low-pressure system. at the centre of a high-pressure system. where there is little variation in pressure over a large area during the winter months.
Question 167-20 : An aircraft flying in the southern hemisphere at 2000 feet has to turn to the right in order to allow for drift in which direction relative to the aircraft is the centre of low pressure ?
In front.
If you need to turn right to counteract the wind because you are drifting left the wind is coming from your rightif you stand with your back to the wind in the northern hemisphere low pressure is on your left buys ballot's law northern hemisphere 542so in the southern hemisphere if you stand with your back to the wind low pressure is on the rightthe wind is coming from your right so the centre of low pressure is in front of the aircraftBehind. to the left. to the right.
Question 167-21 : Between which latitudes are you most likely to find the subtropical high pressure belt ?
25° 35°.
58410° - 15°. 35° - 55°. 55° - 75°.
Question 167-22 : 'after such a fine day the ring around the moon was a bad sign yesterday evening for the weather today and sure enough it is pouring down outside the clouds are making an oppressively low ceiling of uniform grey but at least it has become a little bit warmer'which of these weather phenomena is being ?
A warm front.
622the ring around the moon halo is caused by the cirrus of the warm frontA blizzard. weather at the back of a cold front. a cold front.
Question 167-23 : What will be the effect on the reading of an altimeter of an aircraft parked on the ground during the period following the passage of an active cold front ?
It will have decreased.
If for example your altimeter was set to 1020 hpa and indication was 500 ft after the passage of the cold front the pressure will increase your altimeter remained at 1020 hpa now shows less than 500 ftIt will remain unchanged. it will have increased. it will show a small increase or decrease.
Question 167-24 : What will be the effect on the reading of an altimeter of an aircraft parked on the ground shortly before an active cold front passes ?
It will be increasing.
Take an example parked on the ground your altimeter subscale setting is 1020 hpa and indicated altitude is 0 ftshortly before the active cold front passes the pressure will begin to fall for your altimeter it is similar as a gain of alitudeyou will see an altitude increase 518It will remain unchanged. it will be decreasing. it will fluctuate up and down by about +/- 50 feet.
Question 167-25 : What will be the effect on the reading of an altimeter of an aircraft parked on the ground as an active cold front is passing ?
It will first increase then decrease.
As the active cold front is passing the pressure will reduced thus the altimeter will show an increase in altitudeafter the cold front surface pressure increases thus the reading of the altimeter will show a decreaseIt will remain unchanged. it will first decrease then increase. it will fluctuate up and down by about +/- 50 feet.
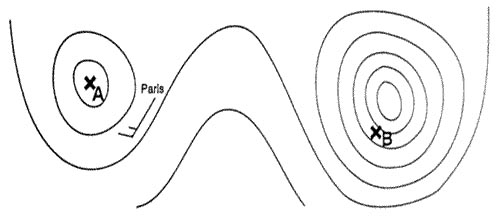
Question 167-26 : Which of the following best describes zone a 299 ?
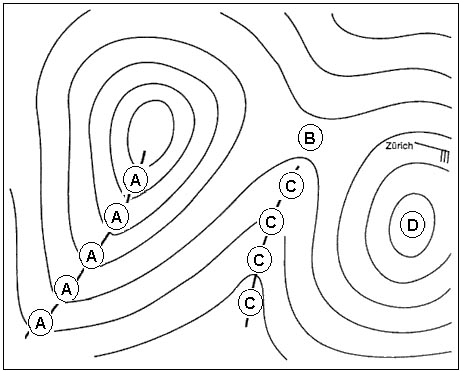
Trough of low pressure.
546Col. ridge of high pressure. depression.
Question 167-27 : Which of the following best describes zone b 299 ?
Col.
546Ridge of high pressure. depression. trough of low pressure.
Question 167-28 : Which of the following best describes zone c 299 ?
Ridge of high pressure.
546Col. trough of low pressure. depression.
Question 167-29 : Which of the following best describes zone d 299 ?
Depression.
546Ridge of high pressure. anticyclone. trough of low pressure.
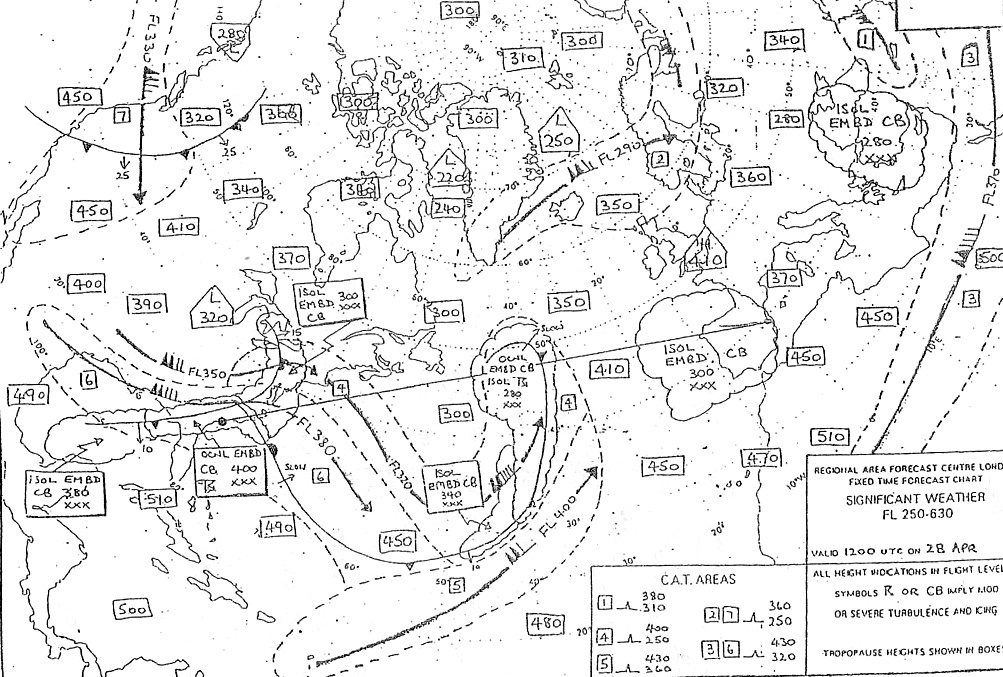
Question 167-30 : At which airport is the following weather development taking place taf 231200z 231322 24014g32kt 4000 +tsra sct005 bkn015 bkn020cb becmg 1416 29012kt 9999 bkn030tcu sct100 tempo 1619 8000 shra bkn025tcu becmg 1922 27012kt 9999 sct030 ovc220 = 302 ?
Einn.
The taf starts at 1300z with surface wind from south west 14 kt gusting 32 kt and heavy thunderstorm and rain typical of cold front conditionsthe change between 1400z and 1600z indicates the passage of the cold front and cold sector polar maritime conditions good visibility cumulus cloud and the odd showerthe chart shows the situation at 1500z and it has just gone through einn that's looking about right the stations in switzerland lszh zurich airport and sweden essa stockholm airport are well clear of any frontal activity so it can't be any of themat 1300z the fronts would be to the west of the scandinavian stations and from the alignment of the isobars we would expect the surface wind to be southerly furthermore the fronts won't hit essa until some time after 1500z so we can rule that one out ekch will go into warm sector conditions tropical maritime poor visibility and possible stratus we are left with engm and the surface wind directions in the taf don't tie in with the isobarsEssa lszh ekch
Question 167-31 : Which of the following weather conditions would be expected at athens airport lgat at around 1450 utc 302 ?
21002kt 6000 br sct040 2916 q1026 nosig =.
Isobars are well spaced it means no or low wind this gives us two possible optionsin may at athens in the afternoon temperature might easily rise up to more than 25°c we have anticyclonic conditions with stable air moderate visibility and heating will raise the cloud base and dissipate some of the cloud26014kt 8000 bkn090 17/12 q1009 becmg 4000 = 23018g35kt 9999 sct035 10/04 q0988 nosig = 16002kt 0200 r33l/0600n fg vv001 12/12 q1031 becmg 0800 =
Question 167-32 : This chart shows the weather conditions on the ground at 0600 utc on may 4 which of the following reports reflects weather development at geneva airport 314 ?
Taf lsgg 040716 23016kt 8000 ra bkn030 ovc070 becmg 0810 5000 ra bkn020 ovc050 tempo 3000 +ra bkn010 ovc030 becmg 1215 25014kt 8000 sct030 bkn090 =.
A warm front is approaching 505as the front is approaching the cloud base gets lower bkn030 ovc070 > bkn020 ovc050 > bkn010 ovc030 the visibility decreases 8000m > 5000m > 3000m and the rain increases ra ra +ra after the warm front the wind turns slightly following the direction of the warm sector isobars visibility increases and the cloud breaks upTaf lsgg 040716 vrb03kt 6000 br sct020 becmg 0811 23005kt 9999 sct025tcu prob 40 tempo 1216 34012g30kt 3000 tsra bkn020cb = taf lsgg 040716 05014kt 5000 ovc015 becmg 0810 8000 bkn018 becmg 1013 05015g30kt 9999 sct025 = taf lsgg 040716 26012kt 9999 sct030 bkn080 tempo 1013 25020g35kt 3000 tsra or +shra bkn030cb becmg 1316 vrb02kt 3000 bcfg sct100 =
Question 167-33 : In zurich during a summer day the following weather observations were taken 160450z 23015kt 3000 +ra sct008 sct020 ovc030 1312 q1010 nosig =160650z 25008kt 6000 sct040 bkn090 1814 q1010 rera nosig =160850z 25006kt 8000 sct040 sct100 1915 q1009 nosig161050z 24008kt 9999 sct040 sct100 2115 q1008 nosig ?
A warm front passed the station early in the morning and a cold front during late afternoon.
A cold front passed the station early in the morning and a warm front during late afternoon a trough line passed the station early in the morning and a warm front during late afternoon storm clouds due to warm air came close to and grazed the station
Question 167-34 : On an aerodrome when a warm front is approaching ?
Qfe and qnh decrease.
When a warm front is approaching the surface pressure decreasesif the qfe was 1000 hpa and qnh 1020 hpa they will become qfe 990 hpa and qnh 1010 hpa for example your altimeter will show an increase of the indicated altitudeafter the warm front in the warm sector surface pressure will remain unchanged and when the cold front will be there surface pressure increase your altimeter will show a decrease of the indicated altitudeQfe and qnh increase. qfe increases and qnh decreases. qfe decreases and qnh increases.
Question 167-35 : An observer on the northern hemisphere is under influence of the wind system of a depression which is moving from west to east the centre of the depression passes to the south of the observerfor this observer the wind direction is ?
Continuously backing.
We are in the northern hemisphere around the depression low wind turns counterclockwisethe observer is north of the depression he sees the wind coming from the south to go north by passing eastthe centre of the depression passes to the south of his position he sees the wind coming from east going to west by passing north for him the wind direction is continuously backing 627Continuously veering. initially backing, then veering. initially veering, then backing.
Question 167-36 : In a warm front occlusion ?
The warm air is lifted.
With a warm occlusion cold front rides up and over the warm front the warm air is lifted 512The warm front overtakes the cold front. the warm front becomes a front aloft. the cold air is lifted.
Question 167-37 : An air mass is unstable when ?
An ascending parcel of air continues to rise to a considerable height.
Temperature and humidity are not constant pressure shows a marked variation over a given horizontal area temperature increases with height
Question 167-38 : An air mass is stable when ?
Lifted air returns to its original level.
Temperature in a given area drops off very rapidly with height. pressure is constant. the lapse rate is 1°c per 100 m.
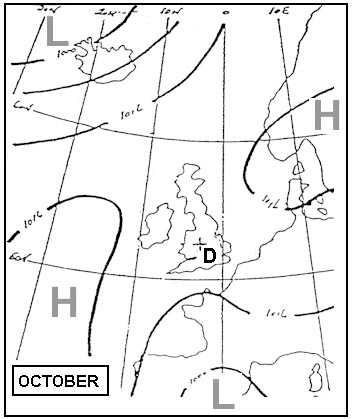
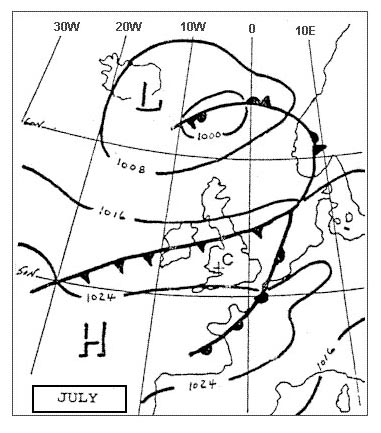
Question 167-39 : The weather most likely to be experienced at position 'r' is 326 ?
Fine and warm at first ac castellanus and cb in late afternoon with thunderstorms.
It's summer time over england few isobars and we are between low and high pressurenot much wind we do not expect any front over our position for the next hours most probably weather will be convective activity nice for the gliders this could produces ac castellanus and cb in late afternoon with thunderstormsEarly morning fog lifting to low stratus. increasing amounts of as and ns, heavy rain. overcast with drizzle and hill fog.
Question 167-40 : An occlusion has the characteristics of a warm front when ?
The cold air behind is warmer than the cold air ahead.
You have cool air behind and cold air ahead 512with a warm occlusion cold front rides up and over the warm front the warm air is liftedThe cold air behind is colder than the cold air ahead. the cold air behind is lifted by the warm air. the cold air ahead is lifted.
Exclusive rights reserved. Reproduction prohibited under penalty of prosecution.