A free Premium account on the FCL.055 website! Read here
Sign up to unlock all our services and 15164 corrected and explained questions.
Question 180-1 : Which of the following extracts of weather reports could be in accordance with the regulations abbreviated to 'cavok' msa minus airport elevation equals lszb 10000 ft lszh 8000 ft lsgg 12000 ft lfsb 6000 ft ? [ Question security ]
Question 180-2 : Within a short interval several flight crews report that they have experienced strong clear air turbulence in a certain airspace what is the consequence of these reports ?
The competent aviation weather office will issue a sigmet.
The airspace in question, will be temporarily closed the competent aviation weather office will issue a speci the competent aviation weather office will issue a storm warning
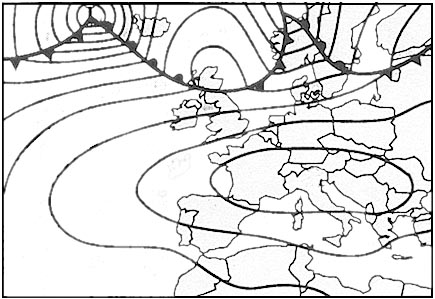
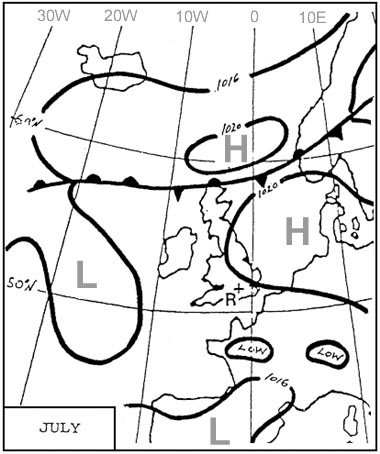
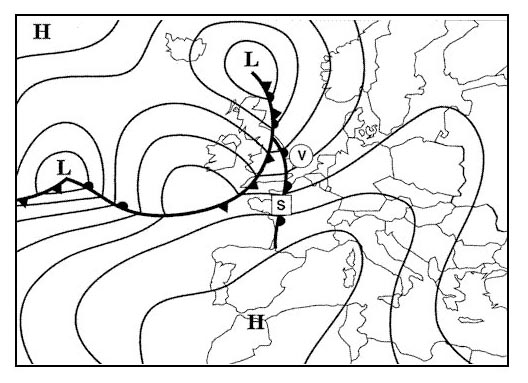
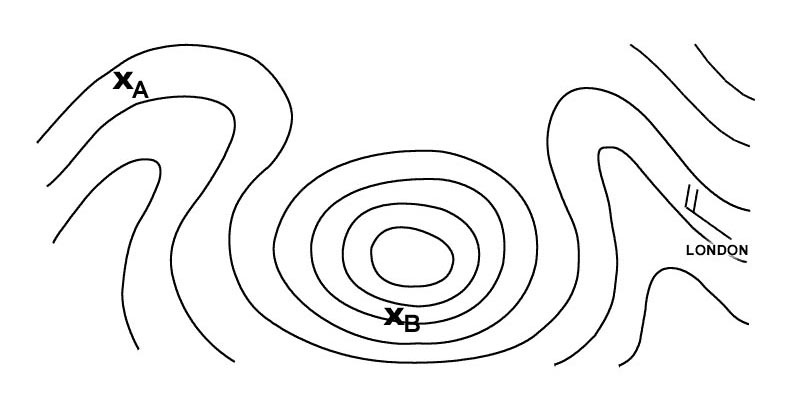
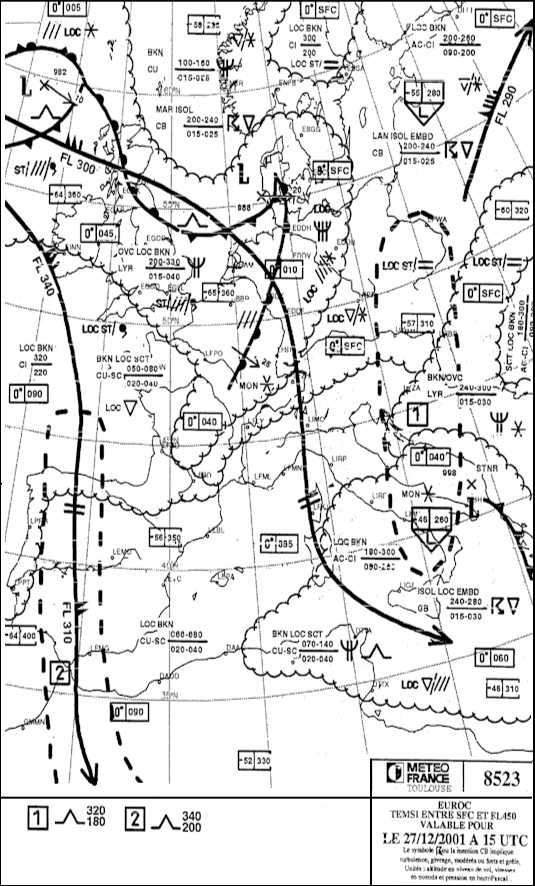
Question 180-3 : At which airport is the following weather development taking place taf 060600z 060716 25006kt 8000 bkn240 becmg 0710 ovc200 becmg 1013 23010kt 8000 ovc100 becmg 1316 23014kt 6000 ra sct030 ovc050 = 265 ?
Eddl.
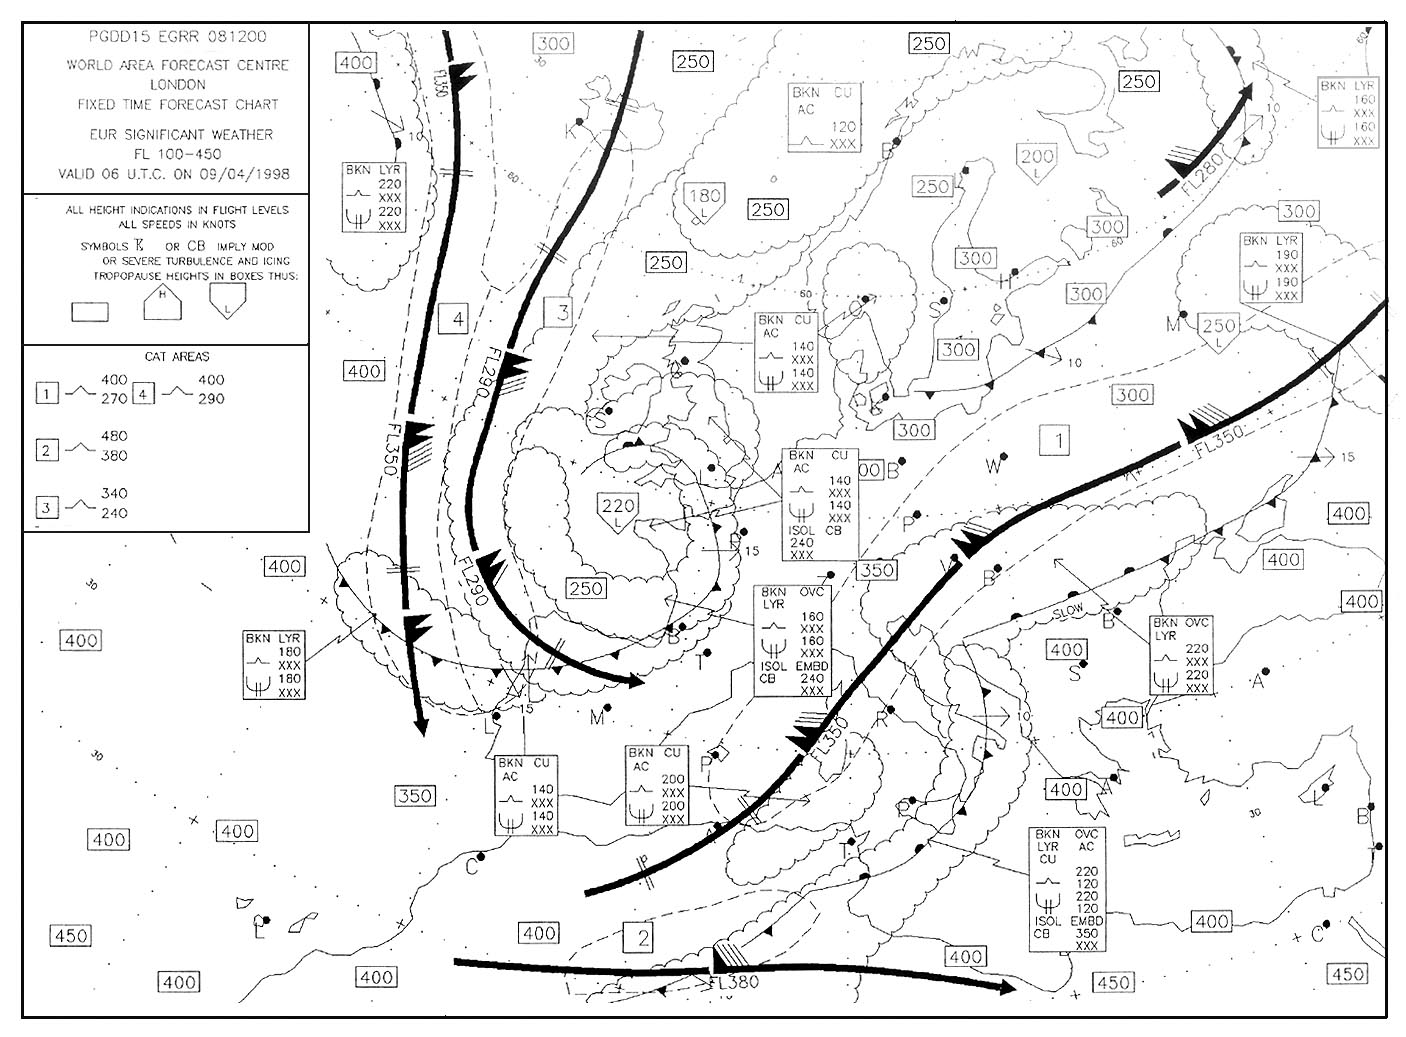
Assuming the map has been issued at the same time of the taf 06h00 utc this taf covers a period from 07h utc to 16 utcthe warm front might reach loww in the late afternoon or during the night so loww is excludedlemd is in a pool area no significant change is expectedlfpo will be reached by the warm front in the next hour so between 07h to 13h the weather expected is rain and no rain is expected before 13h 505the steadily decreasing cloud base indicates that eddl is corresponding to the tafLfpo loww lemd
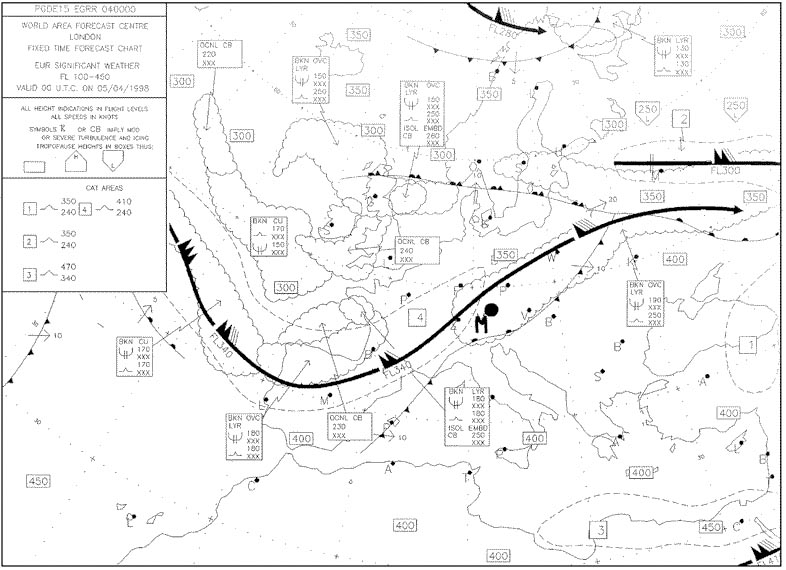
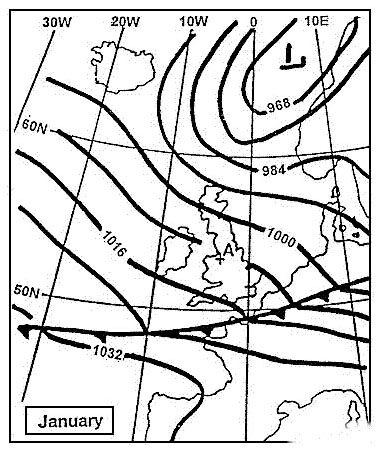
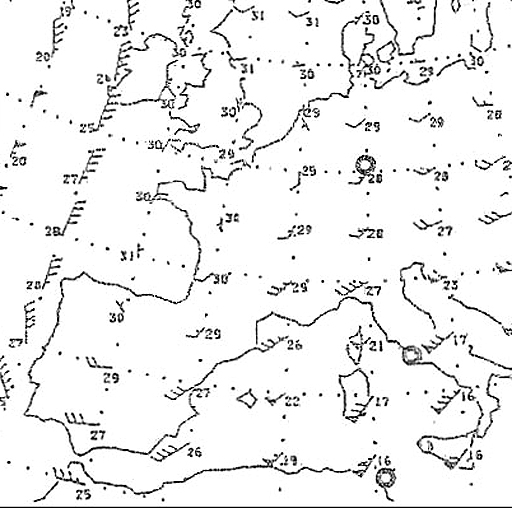
Question 180-4 : What weather conditions are expected at paris airport lfpo around 0550 utc 266 ?
A warm front is approaching lfpo 505you can expect a low cloud base poor visibility and rain after you will get the warm sector weather warmer air stratus 26012kt 9999 sct025 sct040 14/09 q1018 tempo 5000 shra = 22020g36kt 1500 tsgr sct004 bkn007 bkn025cb 18/13 q1009 becmg nsw = 20004kt 8000 sct110 sct250 22/08 q1016 nosig =
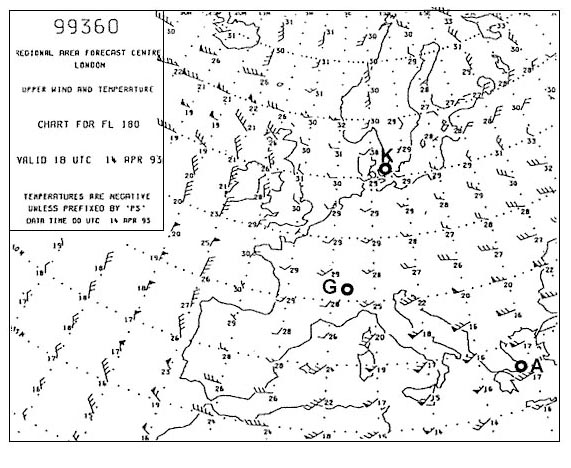
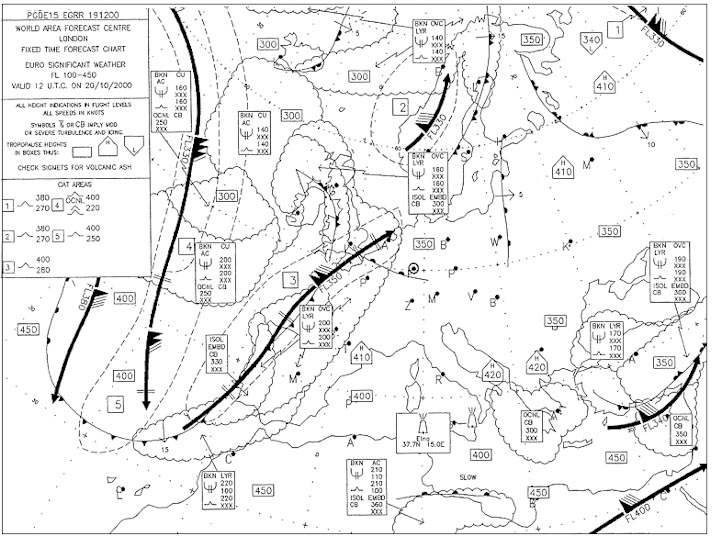
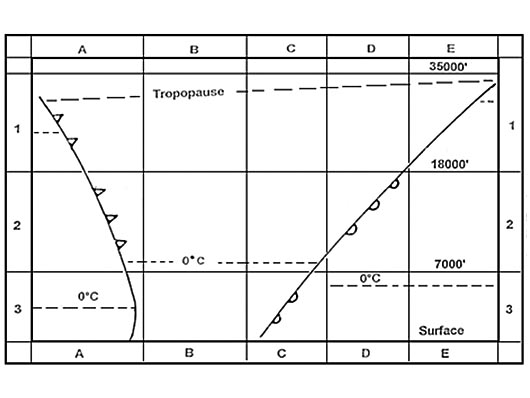
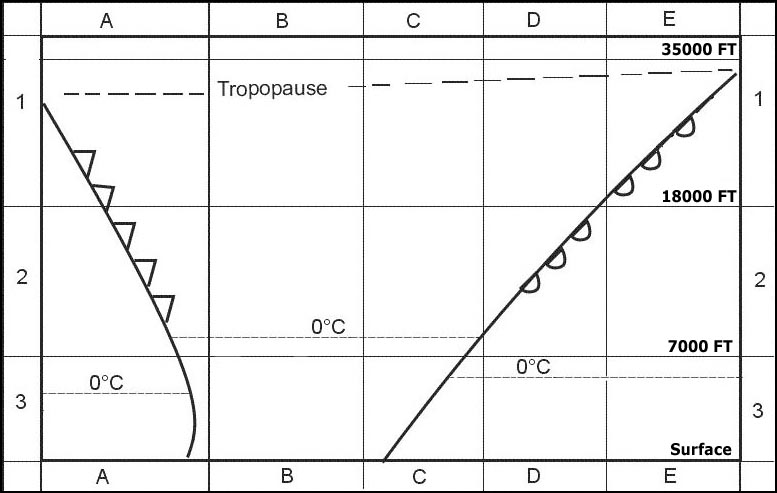
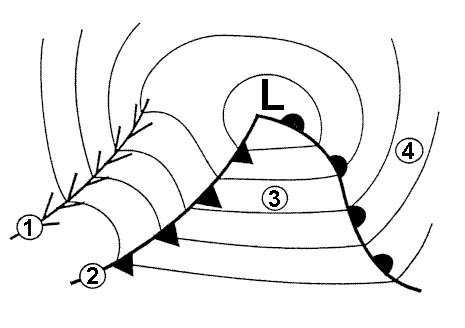
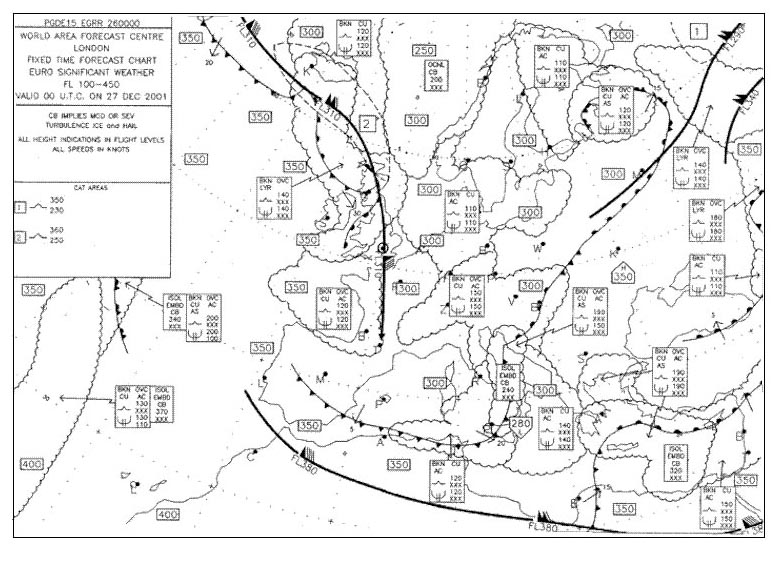
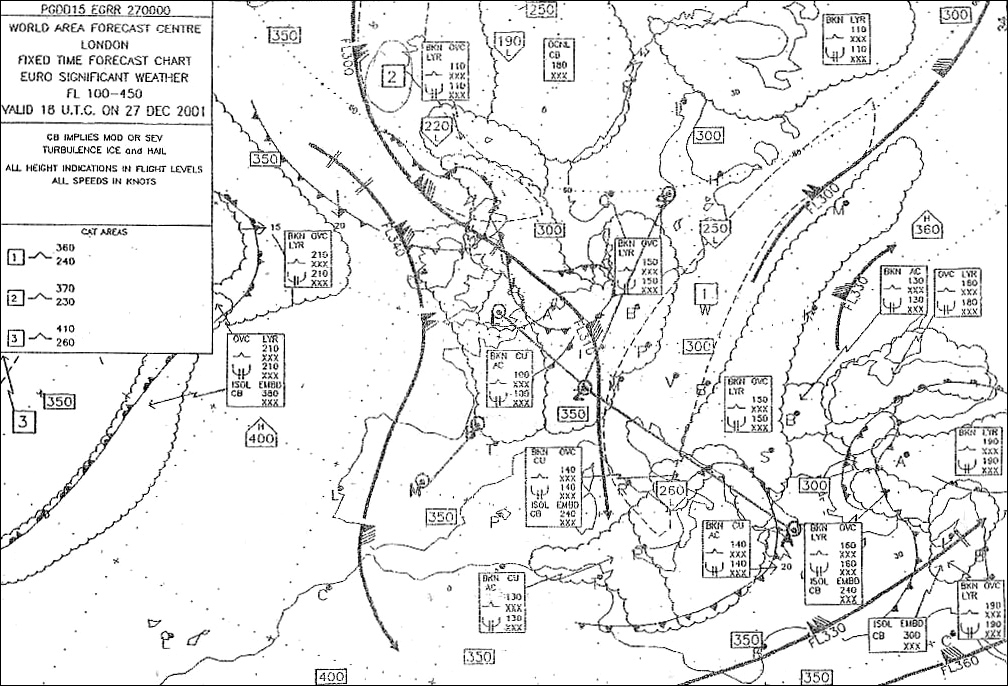
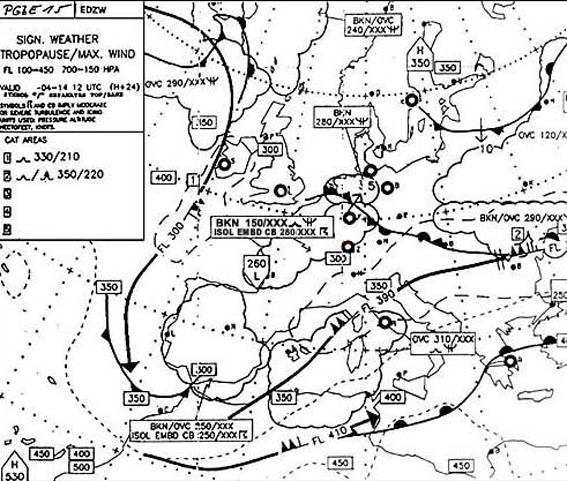
Question 180-5 : What is the optimum flight level between rome and paris according to the significant weather chart 270 ?
Fl 220.
At fl 220 we are above the the moderate icing and moderate turbulence layer which goes up to fl180 and we are below the jet at fl340 and the clear air turbulence aera cat square n°3 located between fl280 and fl380Fl 340. fl 160. fl 360.
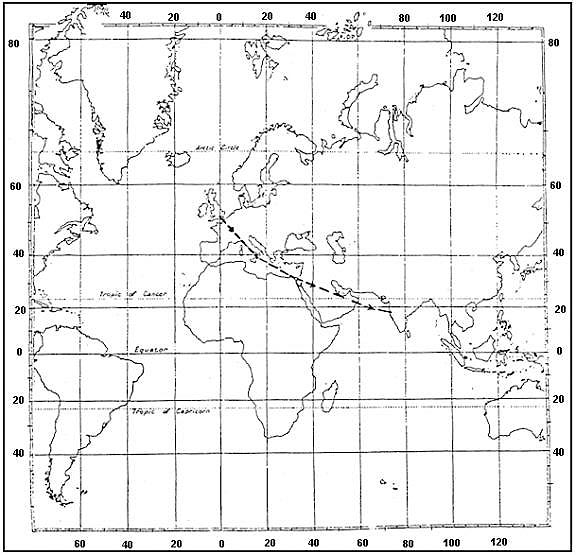
Question 180-6 : Flight shannon to london what amount and type of cloud is forecast for the eastern sector of the route between shannon and london at fl 220 286 ?
Individual cumulonimbus.
From the ground to fl270 on the eastern sector of the route the type of cloud forecast are individual cbs'isol cb' meaning 'isolated cumulonimbus'Overcast nimbo layered cumulonimbus. scattered towering cumulus. scattered castellanus.
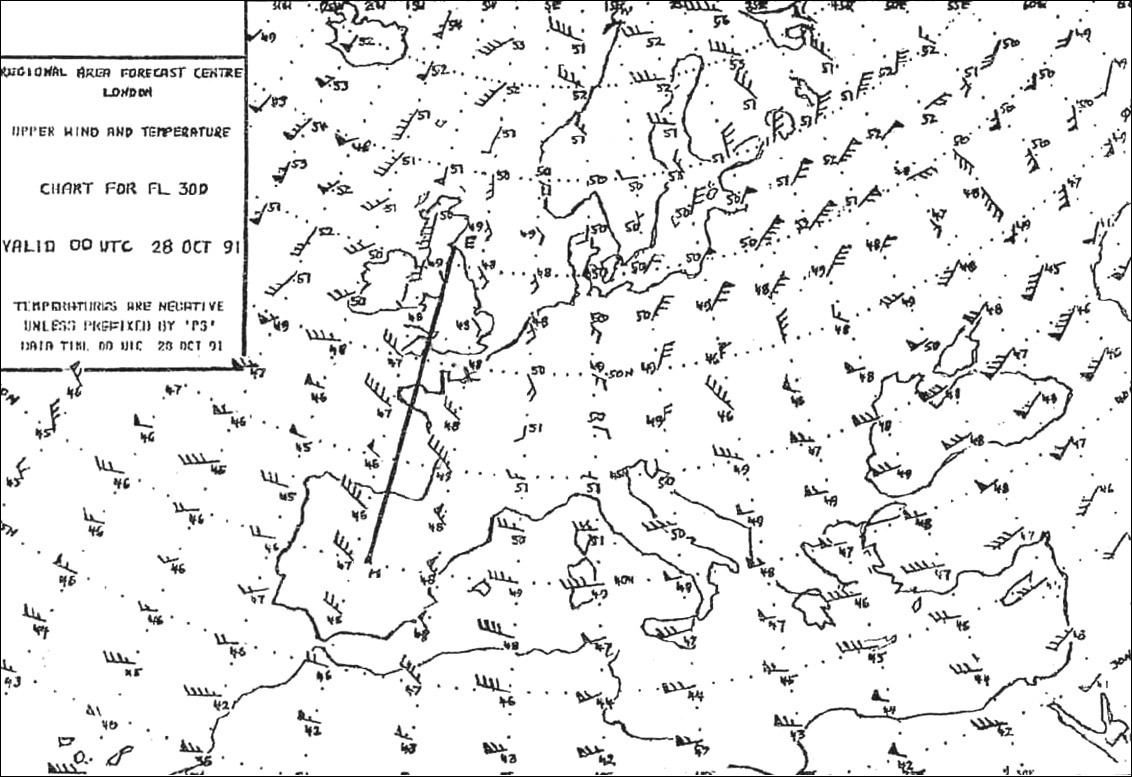
Question 180-7 : Over amsterdam what amount and general type of cloud would you expect at fl 160 287 ?
Mainly 5 to 8 oktas of stratiform cloud in layers.
Broken bkn = 5 to 7 oktasovercast ovc = 8 oktaslyr = layer = stratiform cloud the cloud base is from below fl 100 up to fl180 there is moderate icing up to fl130 and moderate turbulence up to fl1804 oktas broken cumulus. isolated cumulonimbus only. 5 to 7 oktas towering cumuliform cloud and with moderate turbulence.
Question 180-8 : To what extent is munich covered by clouds 288 ?
5 to 8 oktas.
530the cloud cover classification is few 18 to 28 cloud coveragesct scattered 38 to 48 cloud coveragebkn broken 58 to 78 cloud coverageovc overcast 88for munich we have bkn and ovc so 5 to 8 oktas1 to 4 oktas. 5 to 7 oktas. 3 to 5 oktas.
Question 180-9 : The following weather message eddm 241200z 24132422 vrb03kt 1500 br ovc004 becmg 24152417 00000kt 0500 fg vv002 tempo 2022 0400 fg vv001 is a ?
9 hour taf.
This is a forecast message valid on the 24th day of the month published at 12h00 utcthe validity of a taf is stated in the taf eddm 241200z 24132213h00 utc to 22h00 utc = 9 hours24 hour taf. speci. metar.
Question 180-10 : In metar messages the pressure group represents the ?
Qnh rounded down to the nearest hpa.
Qnh rounded down due to safety reasonsQfe rounded to the nearest hpa. qnh rounded up to the nearest hpa. qfe rounded down to the nearest hpa.
Question 180-11 : While approaching your destination aerodrome you receive the following message rvr runway 23 400mthis information indicates the ?
Length of runway which a pilot in an aircraft on the ground would see on the threshold of runway 23.
Visibility on runway 23. portion of runway which a pilot on the threshold of any of the runways would see, with runway 23 in service. minimum visibility at this aerodrome, with runway 23 being the one in service.
Question 180-12 : What is the meaning of the abbreviation sct ?
3 4 oktas.
1 - 2 oktas 5 - 7 oktas 1 - 4 oktas
Question 180-13 : Marseille information gives you the following meteorological information for ajaccio and calvi for 1600 utc ajaccio wind 360°2 kt visibility 2000 m rain bkn stratocumulus at 1000 ft ovc altostratus at 8000 ft qnh 1023 hpacalvi wind 040°2 kt visibility 3000 m mist few stratus at 500 ft sct ?
1000 ft at ajaccio and 9000 ft at calvi.
The requirements for cloud to be considered a ceiling is more than 4 oktasajaccio the bkn cloud at 1000 ft is at a lower level than the ovc cloud at 8000 fttherefore the bkn 5 to 7 oktas cloud at 1000 ft is the start of the ceilingat calvi the few and sct layers are lower than 4 oktas therefore the ovc 7 to 8 oktas cloud at 9000 ft is the start of the ceiling1000 ft at ajaccio and 500 ft at calvi. 8000 ft at ajaccio and 9000 ft at calvi. 1000 ft at ajaccio and 2000 ft at calvi.
Question 180-14 : To which aerodrome is the following taf most applicable taf 231019 24014kt 6000 sct030 bkn100 tempo 1113 25020g38kt 2500 +tsra sct008 bkn025cb becmg 1315 28012kt 9999 sct025 tempo 5000 shra bkn020 becmg 1719 27008kt 9999 sct030 291 ?
Loww.
We have a tempo between 11h and 13h showing the passage of a front thus lemd and ekch can be eliminated the cold front east of ekch is passed at least 5h ago now behind a cold front the visibility outside precipitation is good and the precipitation is showers and it's what the taf indicates between 13h to 19h this situation concerns loww and the forecast wind also indicates loww lfpg will have strong wind during this period Lfpg. lemd. ekch.
Question 180-15 : Refer to the following taf extract becmg 12181221 2000 br bkn004 becmg 12211224 0500 fg vv001what visibility is forecast for 2400 utc ?
500 m.
2000 m. between 500 m and 2000 m. between 0 m and 1000 m.
Question 180-16 : Refer to the following taf extract becmg 12181221 2000 br bkn004 becmg 12211224 0500 fg vv001what does the abbreviation 'vv001' mean ?
Vertical visibility 100 ft.
Rvr less than 100 m. rvr greater than 100 m. vertical visibility 100 m.
Question 180-17 : What does the term metar signify ?
A metar signifies the actual weather report at an aerodrome and is generally issued in half ho y intervals.
A metar is a warning of dangerous meteorological conditions within a fir. a metar is a flight forecast, issued by the meteorological station several times daily. a metar is a landing forecast added to the actual weather report as a brief prognostic report.
Question 180-18 : How long from the time of observation is a trend in a metar valid ?
2 hours.
9 hours. 1 hour. 30 minutes.
Question 180-19 : What is a speci ?
A special aerodrome weather report issued when a significant change of the weather conditions have been observed.
A routine aerodrome weather report issued every 3 hours. a warning of meteorological dangers at an aerodrome, issued only when required. an aerodrome forecast issued every 9 hours.
Question 180-20 : Refer to the following taf extract becmg 12181221 2000 bkn004 becmg 12211224 0500 vv001what does the 'becmg' data indicate for the 18 to 21 hour time frame ?
The new conditions are achieved between 1800 and 2100 utc.
A quick change to new conditions between 1800 and 1900 utc. many short term changes in the original weather. many long term changes in the original weather.
Question 180-21 : Refer to the following taf extract becmg 12181221 2000 br bkn004 becmg 12211224 0500 fg vv001what does the abbreviation bkn004 mean ?
5 7 oktas ceiling 400 ft.
1 - 4 oktas, ceiling 400 ft. 4 - 8 oktas, ceiling 400 m. 1 - 4 oktas, ceiling 400 m.
Question 180-22 : Refer to the following taf extract becmg 12181221 2000 br bkn004 becmg 12211224 0500 fg vv001what does the abbreviation 'prob30' mean ?
Probability of 30%.
Conditions will last for at least 30 minutes. the cloud ceiling should lift to 3000 ft. change expected in less than 30 minutes.
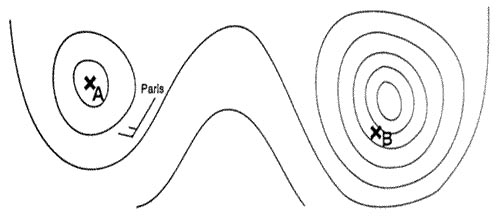
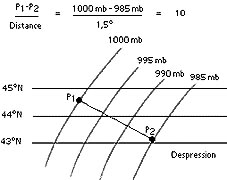
Question 180-23 : Select the true statement concerning isobars and wind flow patterns around high pressure and low pressure systems that are shown on a surface weather chart ?
When the isobars are close together the pressure gradient force is greater and wind velocities are stronger.
Surface winds flow perpendicular to the isobars. isobars connect contour lines of equal temperature. when the isobars are far apart, crest of standing waves may be marked by stationary lenticular clouds.
Question 180-24 : What is the wind speed given in a metar report based on ?
The average speed of the previous 10 minutes.
The average speed of the previous 30 minutes the strongest gust in the previous hour the actual speed at the time of recording
Question 180-25 : What are the images of satellites provided daily by the weather service used for ?
To locate fronts in areas with few observation stations.
To measure wind currents on the ground to help provide 14-day forecasts to locate precipitation zones
Question 180-26 : Which constant pressure altitude chart is standard for fl 100 ?
700 hpa.
There is a few questions in the exam that take information directly from that table below write these down on a sticky and have them on the wall beside you 1013 hpa = msl850 hpa = fl50700 hpa = fl100500 hpa = fl180300 hpa = fl300200 hpa = fl390any others you can interpolate between these and figure it outthe decrease of 1hpa27ft is only applicable at the lower levels of the troposphere as you go up and air pressure decreases the change of height per 1 hpa increases at msl 1hpa27ft at fl180 it's 50fthpa and at fl390 it's 105fthpa 850 hpa. 500 hpa. 300 hpa.
Question 180-27 : Which constant pressure altitude chart is standard for fl 180 ?
500 hpa.
There is a few questions in the exam that take information directly from that table below write these down on a sticky and have them on the wall beside you 1013 hpa = msl850 hpa = fl50700 hpa = fl100500 hpa = fl180300 hpa = fl300200 hpa = fl390any others you can interpolate between these and figure it outthe decrease of 1hpa27ft is only applicable at the lower levels of the troposphere as you go up and air pressure decreases the change of height per 1 hpa increases at msl 1hpa27ft at fl180 it's 50fthpa and at fl390 it's 105fthpa 300 hpa. 200 hpa. 700 hpa.
Question 180-28 : Which constant pressure altitude chart is standard for fl 300 ?
300 hpa.
There is a few questions in the exam that take information directly from that table below write these down on a sticky and have them on the wall beside you 1013 hpa = msl850 hpa = fl50700 hpa = fl100500 hpa = fl180300 hpa = fl300200 hpa = fl390any others you can interpolate between these and figure it outthe decrease of 1hpa27ft is only applicable at the lower levels of the troposphere as you go up and air pressure decreases the change of height per 1 hpa increases at msl 1hpa27ft at fl180 it's 50fthpa and at fl390 it's 105fthpa 200 hpa. 700 hpa. 500 hpa.
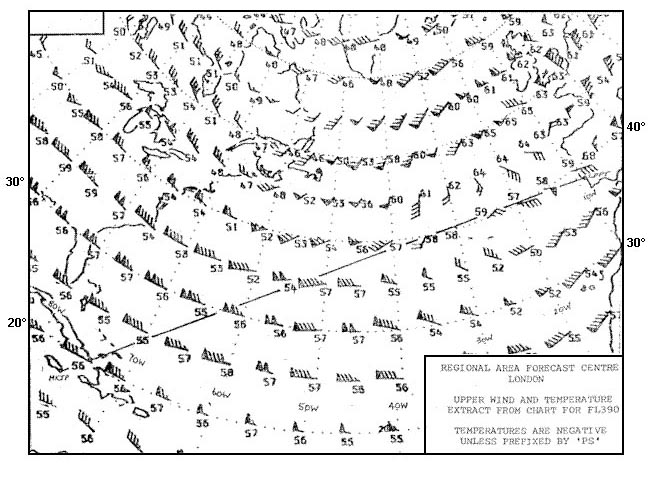
Question 180-29 : Which constant pressure altitude chart is standard for fl 390 ?
200 hpa.
There is a few questions in the exam that take information directly from that table below write these down on a sticky and have them on the wall beside you 1013 hpa = msl850 hpa = fl50700 hpa = fl100500 hpa = fl180300 hpa = fl300200 hpa = fl390any others you can interpolate between these and figure it outthe decrease of 1hpa27ft is only applicable at the lower levels of the troposphere as you go up and air pressure decreases the change of height per 1 hpa increases at msl 1hpa27ft at fl180 it's 50fthpa and at fl390 it's 105fthpa 500 hpa. 700 hpa. 300 hpa.
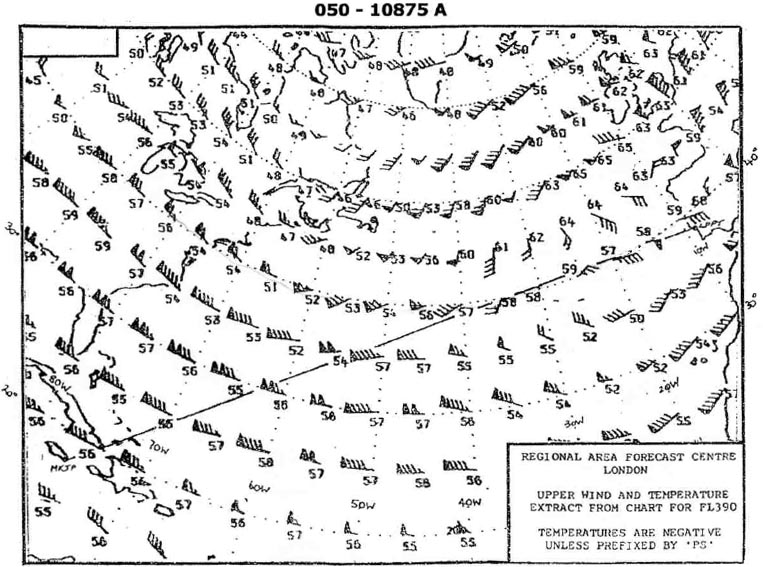
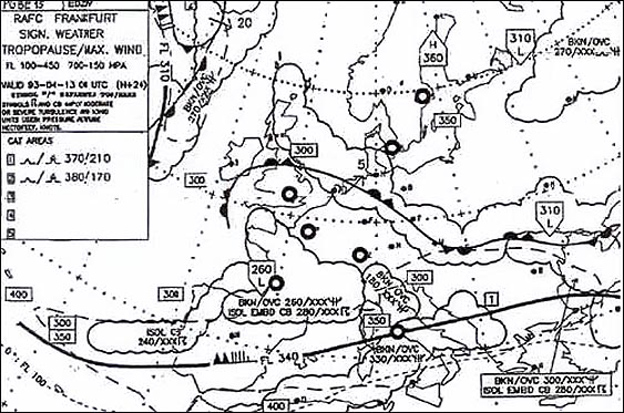
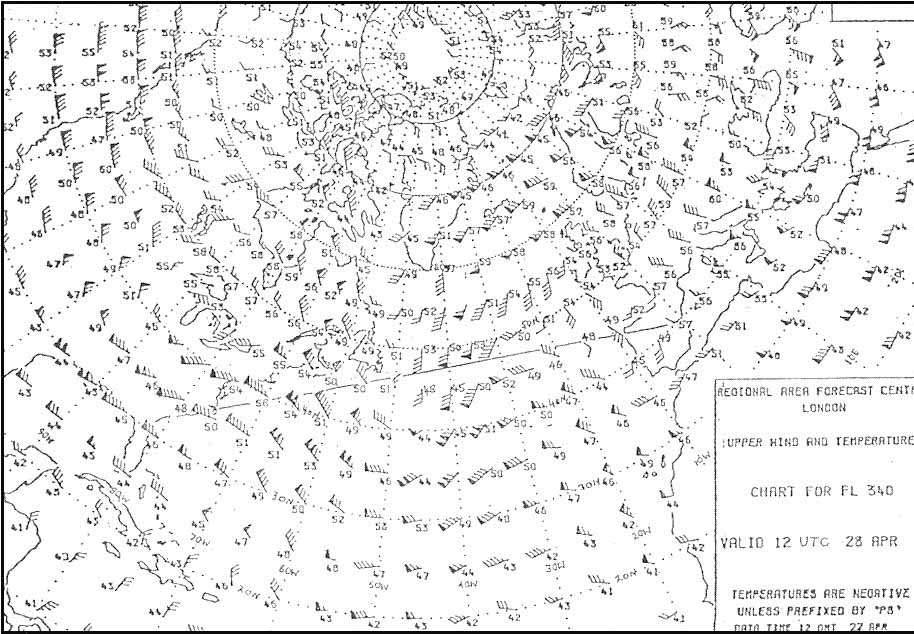
Question 180-30 : If you are planning a flight at fl 170 which of these upper wind and temperature charts would be nearest your flight level ?
500 hpa.
There is a few questions in the exam that take information directly from that table below write these down on a sticky and have them on the wall beside you 1013 hpa = msl850 hpa = fl50700 hpa = fl100500 hpa = fl180300 hpa = fl300200 hpa = fl390any others you can interpolate between these and figure it outthe decrease of 1hpa27ft is only applicable at the lower levels of the troposphere as you go up and air pressure decreases the change of height per 1 hpa increases at msl 1hpa27ft at fl180 it's 50fthpa and at fl390 it's 105fthpa 300 hpa. 850 hpa. 700 hpa.
Question 180-31 : If you are planning a flight at fl 290 which of these upper wind and temperature charts would be nearest your flight level ?
300 hpa.
There is a few questions in the exam that take information directly from that table below write these down on a sticky and have them on the wall beside you 1013 hpa = msl850 hpa = fl50700 hpa = fl100500 hpa = fl180300 hpa = fl300200 hpa = fl390any others you can interpolate between these and figure it outthe decrease of 1hpa27ft is only applicable at the lower levels of the troposphere as you go up and air pressure decreases the change of height per 1 hpa increases at msl 1hpa27ft at fl180 it's 50fthpa and at fl390 it's 105fthpa 500 hpa. 700 hpa. 850 hpa.
Question 180-32 : When planning a flight at fl 60 which upper wind and temperature chart would be nearest your flight level ?
850 hpa.
There is a few questions in the exam that take information directly from that table below write these down on a sticky and have them on the wall beside you 1013 hpa = msl850 hpa = fl50700 hpa = fl100500 hpa = fl180300 hpa = fl300200 hpa = fl390any others you can interpolate between these and figure it outthe decrease of 1hpa27ft is only applicable at the lower levels of the troposphere as you go up and air pressure decreases the change of height per 1 hpa increases at msl 1hpa27ft at fl180 it's 50fthpa and at fl390 it's 105fthpa 700 hpa. 500 hpa. 300 hpa.
Question 180-33 : When planning a flight at fl 110 which upper wind and temperature chart would be nearest your flight level ?
700 hpa.
There is a few questions in the exam that take information directly from that table below write these down on a sticky and have them on the wall beside you 1013 hpa = msl850 hpa = fl50700 hpa = fl100500 hpa = fl180300 hpa = fl300200 hpa = fl390any others you can interpolate between these and figure it outthe decrease of 1hpa27ft is only applicable at the lower levels of the troposphere as you go up and air pressure decreases the change of height per 1 hpa increases at msl 1hpa27ft at fl180 it's 50fthpa and at fl390 it's 105fthpa 850 hpa. 300 hpa. 500 hpa.
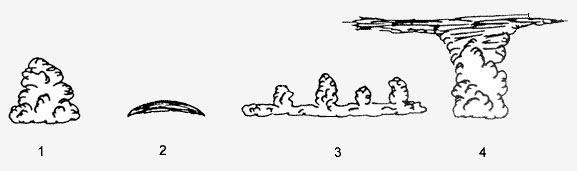
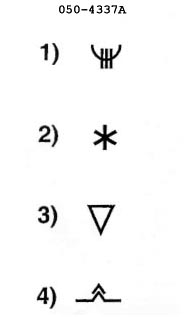
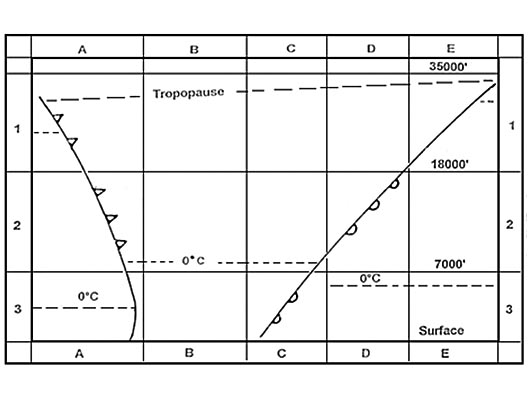
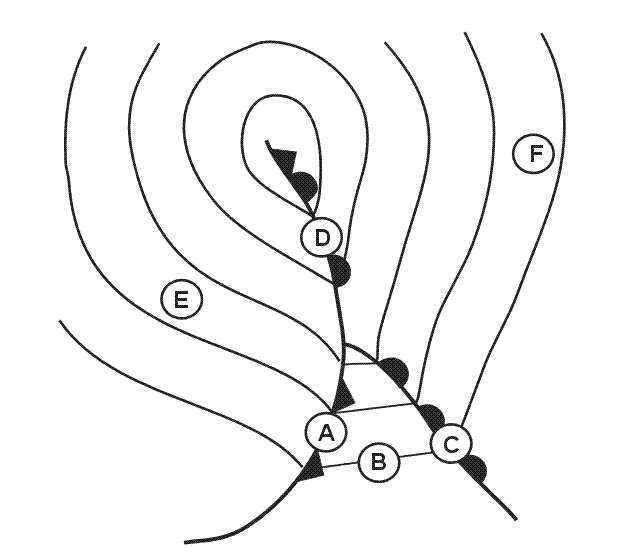
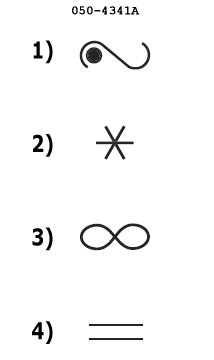
Question 180-34 : According to icao which symbol indicates severe icing 300 ?
1.
Icao annex 3 meteorological service for international air navigation 5472. 3. 4.
Question 180-35 : According to icao which symbol indicates a tropical revolving storm 301 ?
Symbol c.
Icao annex 3 meteorological service for international air navigation 547Symbol a) symbol d) symbol b)
Question 180-36 : According to icao which symbol indicates widespread haze 301 ?
Symbol b.
Icao annex 3 meteorological service for international air navigation 547Symbol c) symbol a) symbol d)
Question 180-37 : According to icao which symbol indicates a severe line squall 301 ?
Symbol a.
Icao annex 3 meteorological service for international air navigation 547Symbol c) symbol d) symbol b)
Question 180-38 : What does the term sigmet signify ?
A sigmet is a warning of dangerous meteorological conditions.
Icao annexe 3 met services sigmet or significant meteorological information is a weather advisory that contains meteorological information concerning the safety of all aircraftthe following are examples of weather phenomena that may be described in a sigmet thunderstorms cyclones tropical revolving storms severe turbulence severe icing severe mountain waves dust or sand storms volcanic ashA sigmet is a flight forecast, issued by the meteorological station several times daily. a sigmet is a brief landing forecast added to the actual weather report. a sigmet is an actual weather report at an aerodrome and is generally issued at half-hourly intervals.
Question 180-39 : What does the term trend signify ?
It is a landing forecast added to the actual weather report.
Icao annex 3 meteorological service for international air navigation63 landing forecasts631 a landing forecast shall be prepared by the meteorological office designated by the meteorological authority concerned as determined by regional air navigation agreement such forecasts are intended to meet the requirements of local users and of aircraft within about one hour's flying time from the aerodrome632 landing forecasts shall be prepared in the form of a trend forecast633 a trend forecast shall consist of a concise statement of the expected significant changes in the meteorological conditions at that aerodrome to be appended to a local routine or local special report or a metar or specithe period of validity of a trend forecast shall be 2 hours from the time of the report which forms part of the landing forecastIt is the actual weather report at an aerodrome and is generally issued at half-hourly intervals. it is a warning of dangerous meteorological conditions. it is a flight forecast, issued by the meteorological station several times daily.
Question 180-40 : Which of these statements best describes the weather most likely to be experienced at 1500 utc taf lszh 21132122 22018g35kt 9999 sct012 bkn030 becmg 21132115 25025g45kt tempo 21172120 4000 +shra bkn025tcu becmg 21202122 25015kt tx182115z tn162118z = ?
Visibility 10 kilometres or more main cloudbase 3000 feet wind 250° temperature 18°c.
In this question the base of the lowest cloud is 1200 ft but there is less than half cover so the main cloudbase is 3000 ftbecmg becoming indicates a change to forecast conditions is expected to occur slowly within the period designated in the time group immediately following the headingin this time group of four digits the first two indicate the beginning hour and the last two represent the ending hour during which the change will take placethe duration of this change is normally about 2 hours the elements included in the becmg line will supercede some of the previous taf groups but it is possible all the groups may changeany group omitted in the becmg line will be the same during the becmg period as indicated in the main taf linefor information tx182115z mean temperature will be 18°c at 1500 utctn162118z mean temperature will be 16°c at 1800 utcVisibility 10 kilometres or more, main cloudbase 1200 feet, gusts up to 45 knots. severe rainshowers, meteorological visibility 4000 metres, temperature 15°c, gusts up to 35 knots. visibility 4000 metres, gusts up to 25 knots, temperature 18°c.
Exclusive rights reserved. Reproduction prohibited under penalty of prosecution.